
Looking Beyond the Activity Numbers
Canton Network's activity can be measured in several ways. Transaction counts, active parties, updates and network traffic each provide a different view of how the network is being used.
However, looking at total activity alone does not tell us which participants contribute the most.
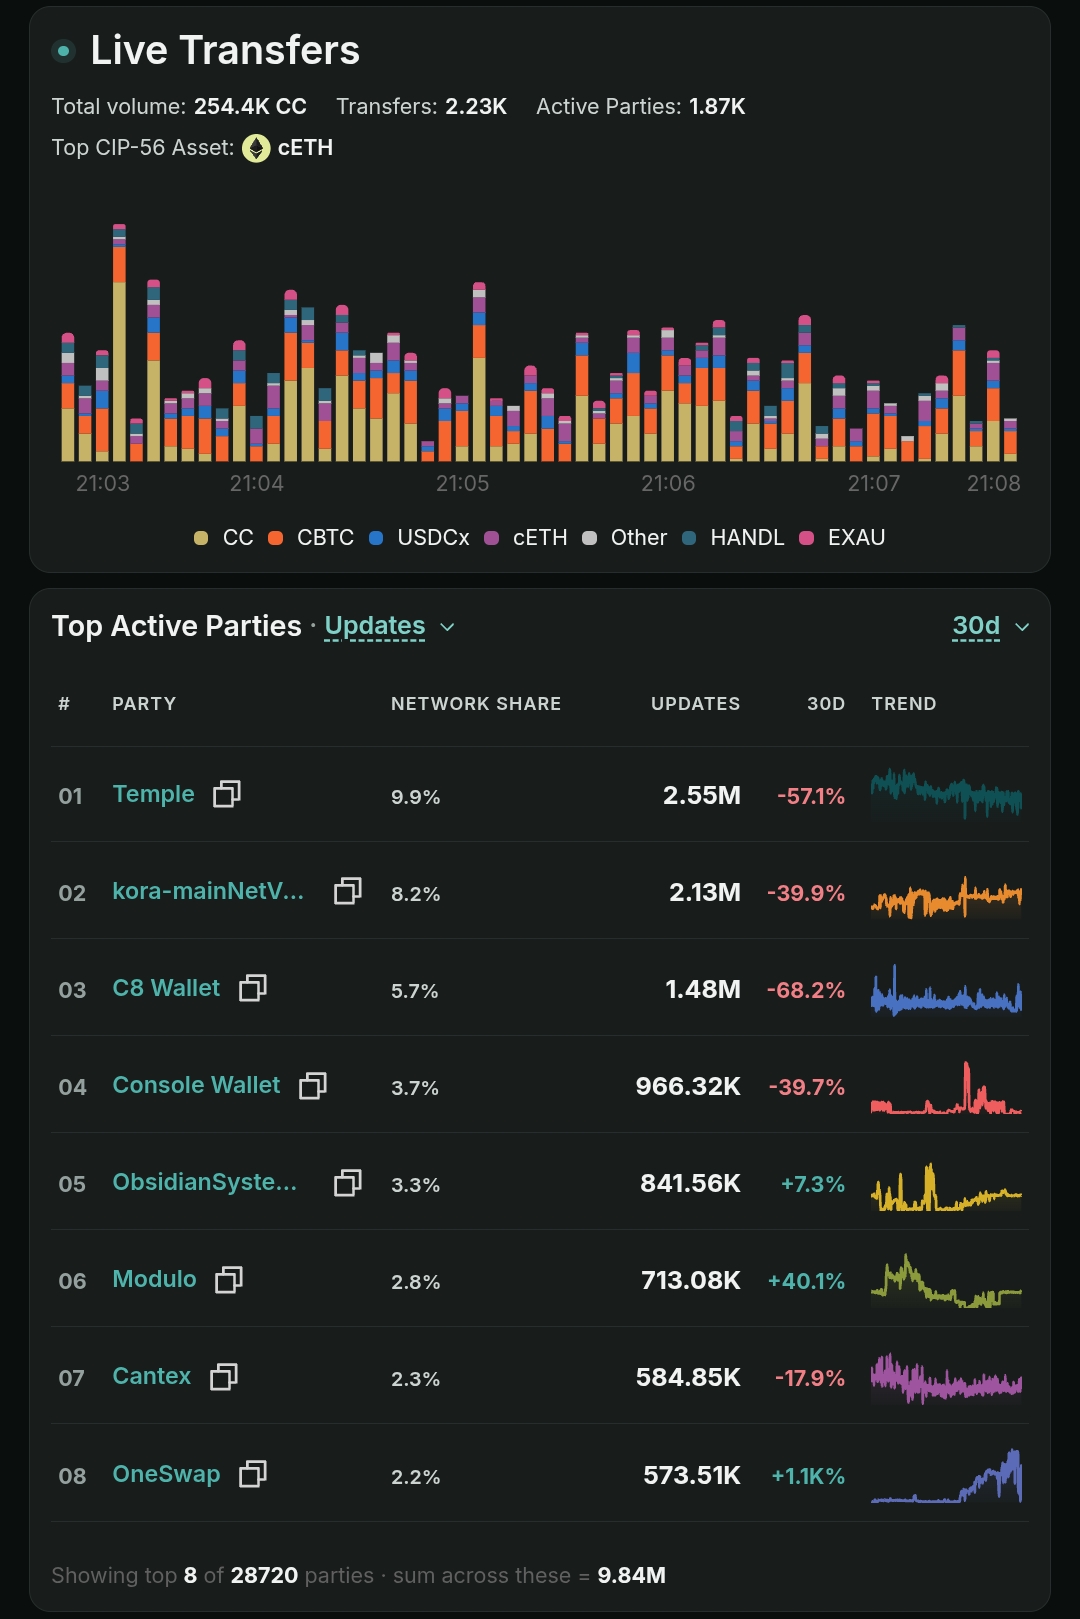
To understand this better, we examined the Top Active Parties data on CCView, focusing on two metrics: updates and traffic over a 30-day period.
The distinction matters because a participant generating a large number of updates does not necessarily consume the largest amount of network traffic.
Who Is Generating the Most Updates?
The first dataset shows the distribution of updates among the most active parties.
Temple leads with approximately 2.55 million updates, representing 9.9% of the displayed network share. kora-mainNet follows with 2.13 million updates at 8.2%.
Other notable participants include C8 Wallet, with 1.48 million updates, and Console Wallet, with approximately 966,320.
The eight participants displayed account for a combined 9.84 million updates.
Temple and kora-mainNet together represent 18.1% of the displayed update share. This gives us an initial indication of how activity is distributed among the leading participants.
Traffic Tells a Different Story
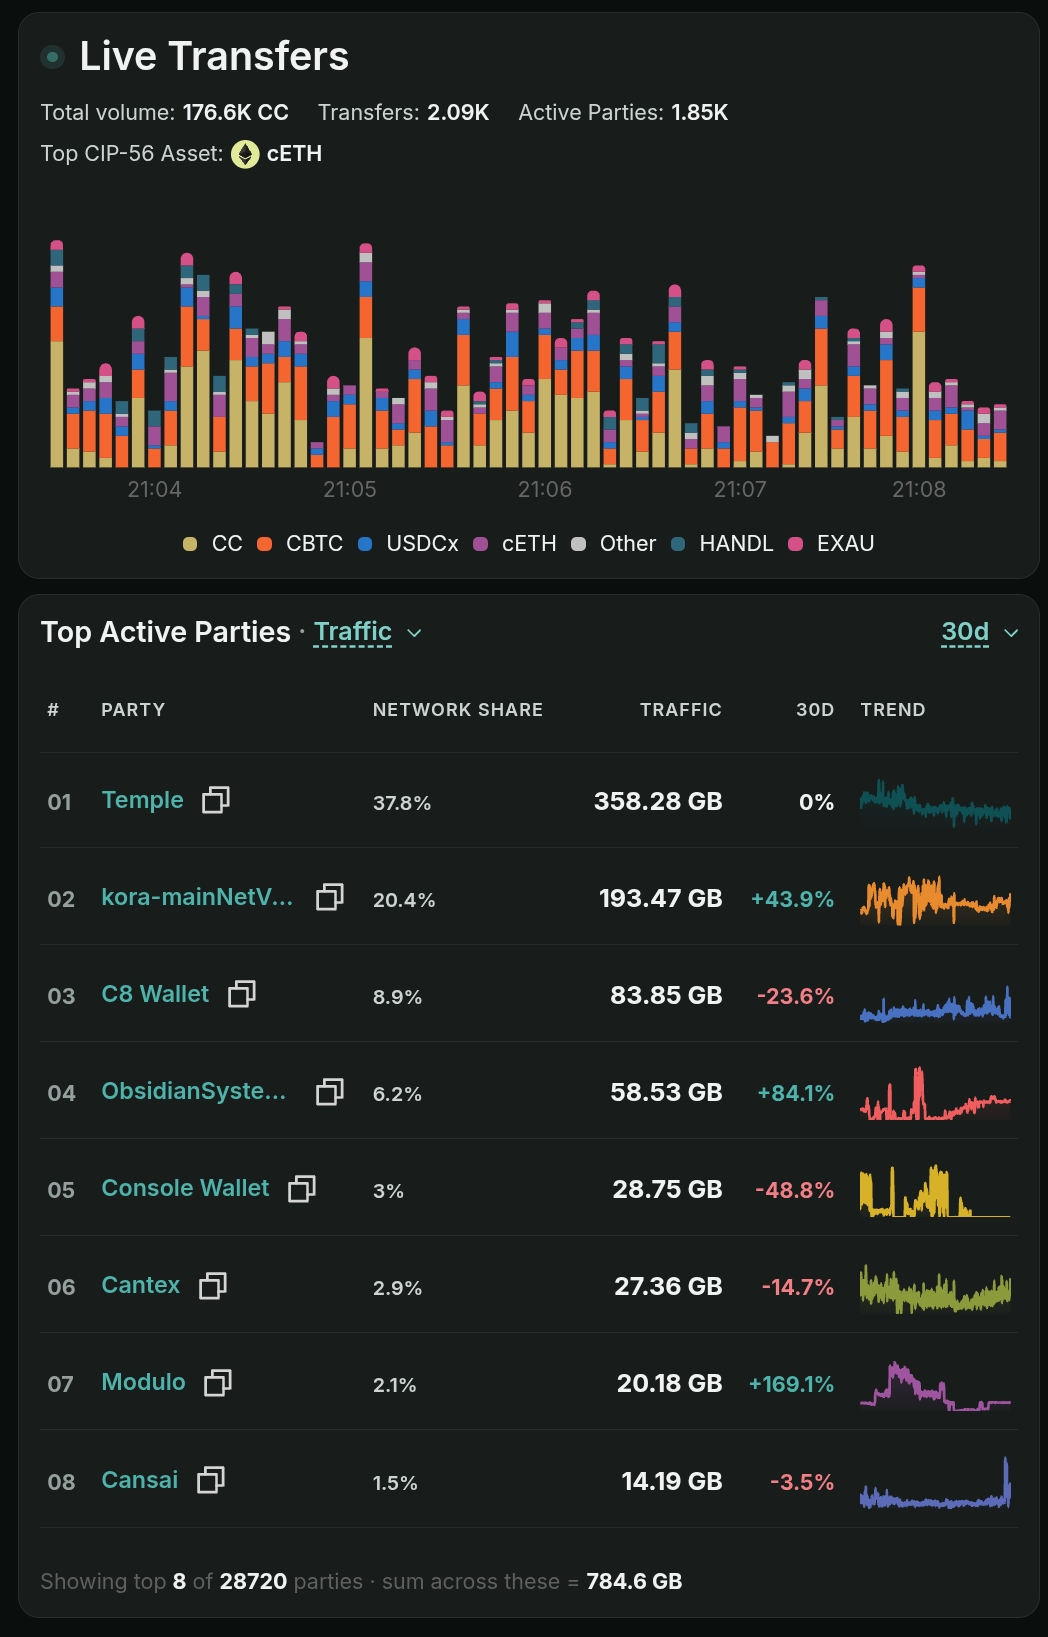
The second dataset reveals a more concentrated distribution.
Temple accounts for 37.8% of the displayed network traffic, representing 358.28 GB over 30 days. kora-mainNet follows with 20.4%, or 193.47 GB.
Together, these two participants account for 58.2% of the displayed network traffic.
The remaining participants include C8 Wallet at 8.9%, ObsidianSystem at 6.2%, Console Wallet at 3%, Cantex at 2.9%, Modulo at 2.1%, and Cansai at 1.5%.
The eight listed participants collectively account for 784.6 GB of traffic.
This is where the comparison becomes interesting. Temple and kora-mainNet represent 18.1% of the displayed update share but 58.2% of the displayed traffic share.
Their contribution to network traffic is considerably larger than their share of updates.
What Does This Distribution Tell Us?
The difference between these two datasets is important.
It shows why update counts alone may not provide a complete picture of network usage. Some participants may generate relatively fewer updates while accounting for a much larger volume of traffic.
There could be several explanations, including the types of applications they operate, the amount of data exchanged, or the nature of their network activity. However, the dashboard figures alone do not establish the reasons behind this difference.
It is also important not to confuse traffic concentration with network control. A participant accounting for a large share of traffic does not automatically control the network or its infrastructure.
The data measures activity, not ownership or governance power.
The Bigger Picture
The available figures show activity across thousands of parties, but that activity is not evenly distributed among the leading participants.
The most interesting finding is the difference between update distribution and traffic distribution. It suggests that understanding Canton's network usage requires looking beyond transaction counts and active-party numbers.
This is only a snapshot of a 30-day period. Comparing these figures over several months, alongside application-level data, would help establish whether participation is becoming more broadly distributed or remaining concentrated among the same major contributors.
For now, the data provides a useful starting point for understanding who is driving activity across Canton Network.